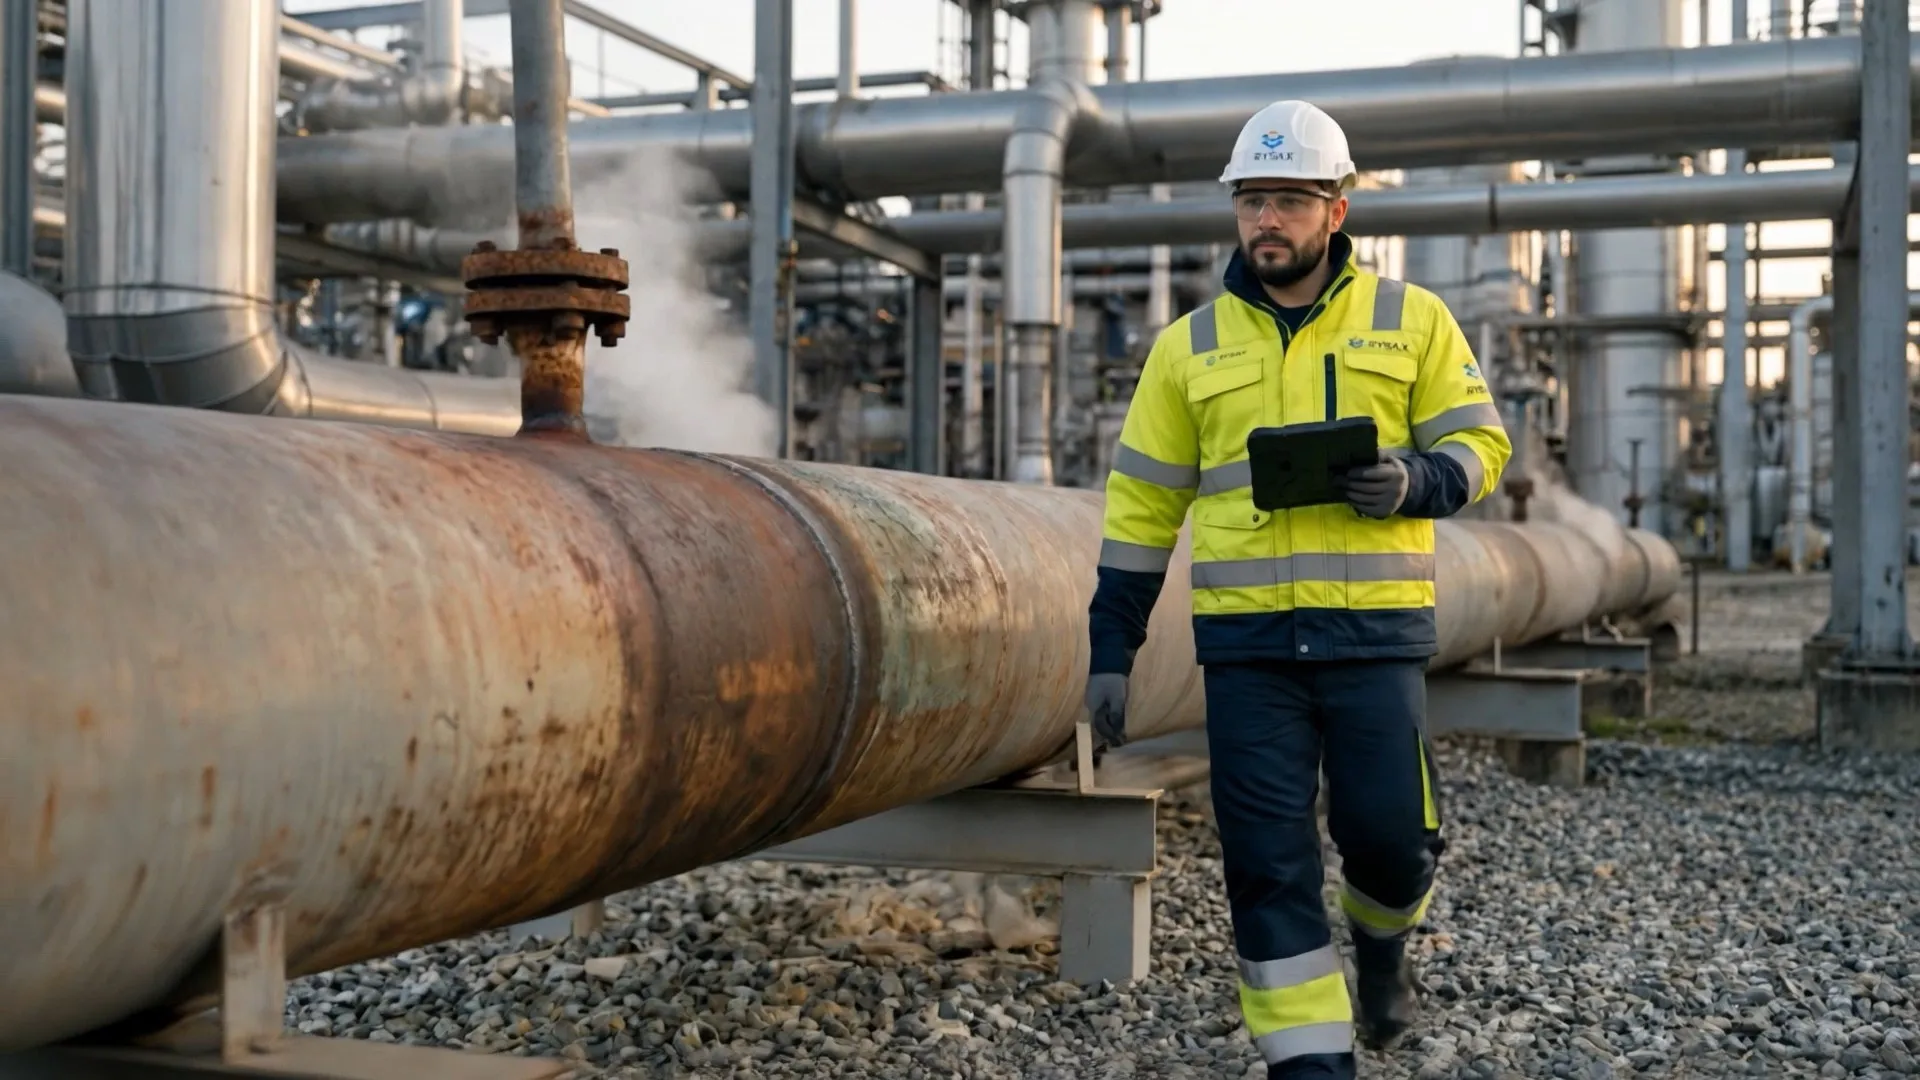
The scope is an estimate. The access it commits you to is real.
How the number a coating budget starts from actually gets made, how far two professionals can disagree once somebody measures it, and what it costs when a scope carries a margin nobody has measured. Every figure here has a primary source.
Every coating program starts with a number: how much surface needs treatment next year, and to what depth. The scaffold, the permit, the shutdown window and the contract are all committed against it.
This is about how that number gets made. Not the tape measures during execution, which is a different problem, and not the monthly measurement afterward, which is a third. The budget moment, before anyone mobilizes, because it is the one that commits the other two.
How the sequence runs
Here is the sequence in most operations, and every step of it is documented.
Somebody walks the asset and forms a view. Coating condition is a judgment call unless it is graded against a standard, and even graded, it stays an estimate of area. How much do two professionals disagree? Where it has been measured properly, a great deal: in field trials where multiple inspectors assessed identical elements, the coefficient of variation was "typically greater than 50%, and often greater than 100%" (Washer et al., Transportation Research Record, 2020, on bridge element condition data). No equivalent study exists for coating grading specifically, which is its own finding and one we publish. The subjectivity is not disputed inside the discipline either: a 2022 state transportation research report concluded that vague coating rating criteria mean "there could be considerable variation in the ratings among various bridge inspectors" (Purdue JTRP for INDOT, 2022). Assessments are made against pictorial standards, and that work is tiring and highly subjective: ask three inspectors to assess the same area for percentage of corrosion, and you will get three significantly different reports.
Two scales are in use, and they describe different objects. ISO 8501-1 grades bare steel, A to D: steel that was never coated, or steel a coating has been stripped off, which makes it a maintenance case too. ISO 4628-3 and ASTM D610 grade how far an existing coating has broken down, Ri 0 to Ri 5 in the ISO scale and 10 to 0 in the ASTM one. In English both standards talk about rust, so the names do not separate them. What separates them is what is in front of the inspector: bare steel, or failing paint. The two coating scales do convert, and ISO 4628-3 publishes the correlation itself, in Annex B, Table B.2. What does not convert is either of them against ISO 8501-1. When your inspector reports against one and your contractor reports against another, the disagreement is one of definition before it is technical.
Then the area gets estimated, and not always measured correctly.
The problem is not who produces the estimate. It is that nobody can check it.
A working group of engineering insurers, written by underwriters from QBE, AXA XL and HDI Global, put it plainly. On estimating the extent of remedial coating areas, "both have a vested interest to estimate higher rather than lower" (IMIA, Coating Failures, 2022, of the paint supplier and the contractor). The same paper names the structural reason: the constructor is interested in productivity, the operator in through-life performance. Two legitimate interests, looking at the same wall, arriving at different numbers.
Nobody designed it this way. It is what happens when there is no measurement either side can point to. And it cuts both ways. A contractor who priced the job correctly has no way to prove it when the number gets questioned, and watches it negotiated down anyway. An operator has no way to know whether the number is right, and pays it anyway. Operators have very limited resources, and sometimes none at all, for assessing corrosivity and estimating coating quantities. That is the context in which the technology becomes necessary: a measurement both sides can stand behind, produced fast enough to be useful.
Then the treatment decision gets made without the test that decides it. Spot repair, overcoating, and full removal and recoat are three different jobs, and the cost ladder assumed in the peer-reviewed literature is steep: roughly 40 percent, 70 percent, and 135 percent of the original coating cost, respectively (Ebrahimi et al., 2025). Which one a component needs turns on whether the existing film will hold a new system, and that is answered by adhesion and patch testing on the asset, not by a rust percentage. A scope built from photographs alone, ours included, has not answered that question. It has told you precisely where to go and ask it.
And the ground keeps moving underneath the number. Maintenance painting costs have risen "200% to 500% over the past decade" on containment and environmental compliance requirements alone (Purdue JTRP for INDOT, 2022). When the surrounding cost of doing the work escalates like that, a scope carrying an unmeasured margin is not a rounding error.
Then the budget gets cut, and nobody records what was deferred. Deferral does not make the same job dearer. It moves the job up the ladder above. Owners rarely record which components were deferred and in what condition, so the following year the conversation starts from zero. The public sector version of this is measurable and alarming: the US federal deferred maintenance backlog more than doubled to $370 billion between 2017 and 2024, and the auditor's own conclusion is that deferred assets "need premature replacement, which can be significantly more expensive than if maintenance and repairs were done when originally scheduled" (GAO, 2025).
And the record that would settle any of it does not exist. Dry film thickness conformance is often mistaken for a condition dataset. It is not, and the standard says so. Follow SSPC-PA 2's own sampling rules on a 20,000 square foot structure and you get 22 measurement areas, 110 spots, 330 gauge readings, each covering a circle about an inch and a half across: roughly four square feet of physically interrogated surface out of twenty thousand, about 0.02 percent (our arithmetic, from the standard's published frequency rules). That is a contract acceptance instrument working exactly as designed. It was never built to answer how much of your site needs painting next year.
None of this is anyone's incompetence. It is what happens when the most consequential inputs in a coating program are impressions, and impressions do not survive contact with an auditor, a budget committee, or five years.
What the standard actually promises
Answering that question is an annual exercise for every maintenance and integrity manager, and it is usually done with less evidence than the number deserves. ISO 12944 is unusually candid about it: the standard defines durability as the expected life of a protective paint system to the first major maintenance painting, and says that durability "is a technical consideration/planning parameter that can help the owner set up a maintenance program." The standard states that the number is a planning input, not a warranty. Planning inputs need data underneath them.
Where coatings actually fail
The detail matters more than it sounds, because the recent evidence points at exactly the things an execution record captures. A 2025 study analyzing inspection imagery from an offshore platform, a ballast water tank system and two coastal bridges found that corrosion mainly initiates at edges and welds, with between 50 and 90 percent of attacks attributable to that, and identified the mechanism as low film thickness where wet paint retracts from sharp edges (Knudsen et al., Materials and Corrosion, 2025). Those are application and design details. They live or die in what was done on the day, and in most operations nobody wrote it down.
Sources
- 1. Inspector variability. Washer, Hammed, Jensen & Connor, "Quality of Element-Level Bridge Inspection Data," Transportation Research Record, 2674(2), 2020. Verbatim: "the smallest coefficient of variation calculated from the current studies was 18%, but typical values were found to be greater than 50% in most cases, and often greater than 100%." Attribution discipline: this is bridge element condition data, not coating rust grading, and the article says so.
- 2. Coating rating subjectivity, and containment cost escalation. Bowman, Hagan & Hurdle, Steel Bridge Coating Evaluation and Rating Criteria, FHWA/IN/JTRP-2022/23, Purdue Joint Transportation Research Program for INDOT, 2022. On subjectivity: "due to the vagueness of the rating method, suggests that there could be considerable variation in the ratings among various bridge inspectors." On cost: "a general increase in maintenance painting costs of 200% to 500% over the past decade." Used twice in Section 3.
- 3. The estimation conflict. IMIA (International Association of Engineering Insurers), Working Group Paper WGP 126 (22), Coating Failures, revised 1 September 2022, page 24. Verbatim: "Both have a vested interest to estimate higher rather than lower."
- 4. The treatment cost ladder. Ebrahimi, Khanlarian, Momeni, Ahmadi & Gallant, "Toward sustainable steel bridge maintenance: anti-corrosion coating systems," Journal of Coatings Technology and Research, 22(6), 2025, pages 2293 to 2312. Open access, peer-reviewed. Verbatim, and the opening words matter: "It is assumed that the coating cost for spot painting, overcoating, and removal and replacement are 40%, 70%, and 135% of the original coating cost, respectively." It is a costing assumption inside a peer-reviewed model, sourced there to Helsel and Lanterman (2022) and Brevoort et al. (1996), not a measured result of the 2025 study. The article now says "assumed in the peer-reviewed literature" rather than "published", and this qualifier travels with the number wherever it goes.
- 5. Deferred maintenance escalation. US Government Accountability Office, GAO-25-108400, April 2025. Backlog more than doubled to $370 billion, FY2017 to FY2024. Verbatim: deferred assets "need premature replacement, which can be significantly more expensive than if maintenance and repairs were done when originally scheduled." English edition only: this is US federal data.
- 6. Where corrosion actually starts. Knudsen, Hagen, Skilbred, Bruaas & Naerland, "Root causes for corrosion on painted steel structures in marine environments," Materials and Corrosion, 76(6), 2025, SINTEF. Verbatim: "corrosion mainly initiates at edges and welds. Between 50% and 90% of the corrosion attacks could be attributed to this, depending on the type of structure. The paint failed due to low film thickness." Abstract verified; the full text is paywalled. If we ever want a per-structure figure rather than the range, we buy the paper first.
- 7. Standards cited directly. ISO 12944-1:2017 for the durability definition, in Section 4. ISO 8501-1, ISO 4628-3 and ASTM D610 for the grading scales, in Section 3, subject to the pending correction. SSPC-PA 2-2022 for the sampling rules, in Section 3. The 0.02 percent figure is our own arithmetic from PA 2's published frequency rules and is labelled as ours in the text.
The estimate is the problem. Measurement is the fix.
PhotoCoat grades condition against the standards your auditors use, takes surface areas from the asset's own geometry, and keeps the record, so next year's number starts from evidence instead of another walk.